Durability analysis using FAMOS
Durability deals with the characteristic of lots of materials to develop microscopic cracks when exposed to repeated load cycles, that sooner or later lead to structural failure – for example, a broken axle or bolt. Those microscopic cracks appear particularly in connection with rather small loads that should be harmless, but repeat often enough (many thousand times).
With FAMOS Enterprise, engineers are able to analyze data from durability tests (for vehicle tests, also called Road Load Data Acquisition or RLDA). They validate simulation results and judge whether real-life loads can turn into an issue over the projected lifetime. If so, material thickness has to be increased or weld lines modified, for example.
FAMOS offers functions for most typically necessary analysis tasks without going into the depths of very expensive specialized software packages. Some of these functions are described in this article.
Written by Daniel Förder, Strategic Product Manager Software and FAMOS expert

Rainflow Analysis in FAMOS
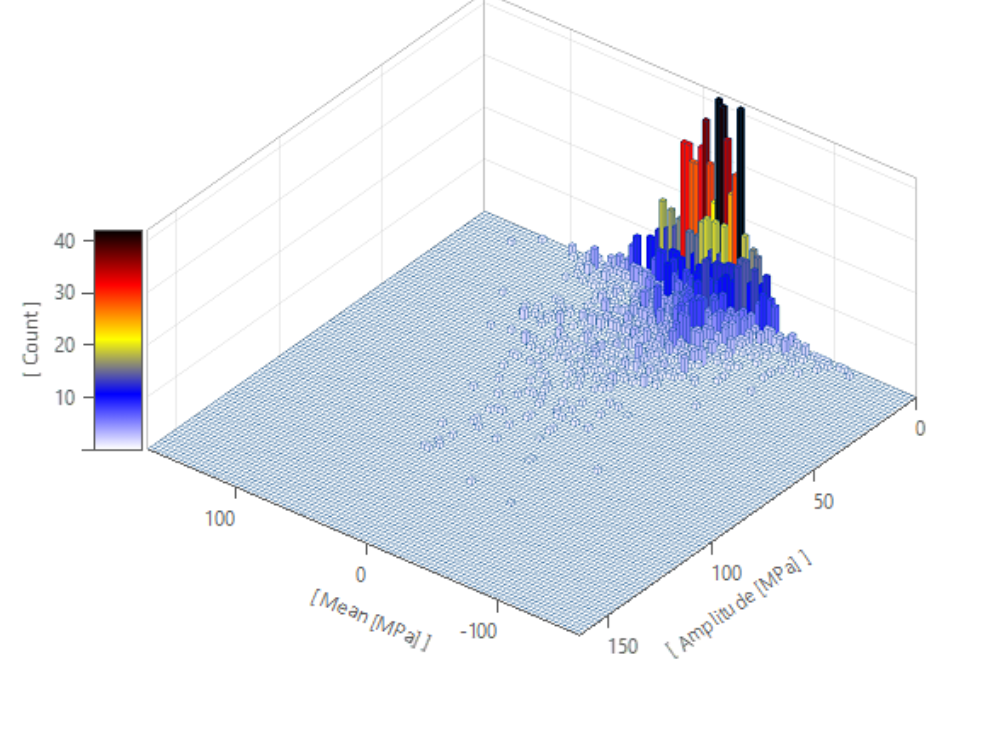
With Rainflow analysis, a sampled time-domain data set becomes a two-dimensional matrix that is structured similarly to a two-dimensional histogram. This matrix contains the determined load cycles, which are systematically extracted from the signal by the Rainflow counting method and then classified by mean value and amplitude.
FAMOS offers the calculation according to ASTM E1049 as well as according to RAINFLOW-HCM (U.H. Clormann, T. Seeger, Stahlbau 3/1986). In addition, it supports a number of parameters for fine-tuning the calculations, such as the number of classes (also called bins) to separate the matrix into, hysteresis to ignore small spans and noise, or whether outer bins should be treated open or closed.
Also, the min and max amplitudes of the classes can be defined. For quick analysis, this is not so important because the actual min and max of the signal are the obvious choice for that, but for comparing several sensor locations or test runs, a unified scaling is important.
If the time-domain data was acquired using strain gauge measurements and still has to be converted from strain (μm/m) to mechanical stress (MPa), or using strain gauge rosettes and still principal strain or principal stress has to be calculated, the standard function library and the formula editor are available.
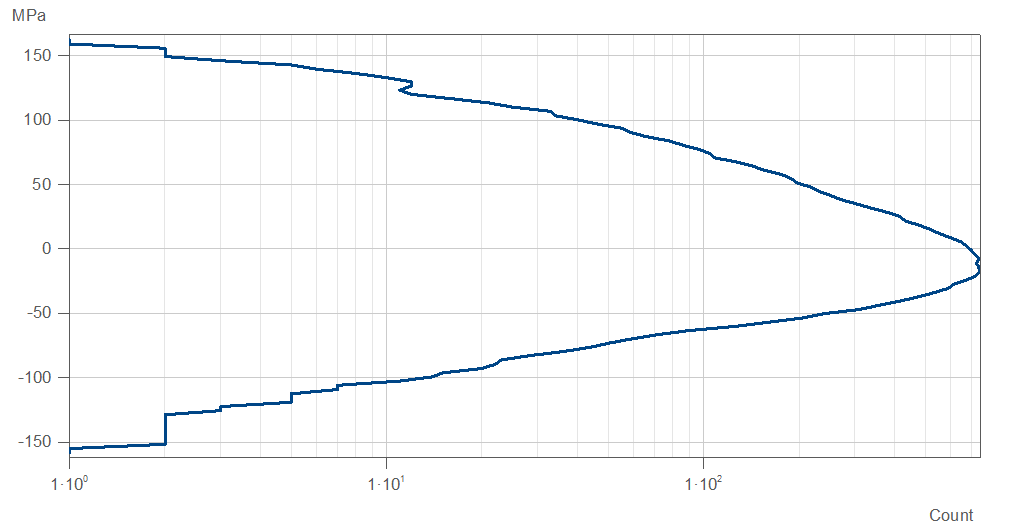
FAMOS Function: Level-Crossing Analysis
Level-crossing diagrams are the result of a typical classification function. It counts the number of times that the measurement signal crosses from one class (e.g. 0 ... 3.2 MPa) to a neighboring class (e.g. 3.2 ... 6.4 MPa). FAMOS offers two ways of calculating that according to DIN 45667:
From the original acquired time-domain signal
From the Rainflow matrix. This is particularly relevant if the Rainflow matrix was already calculated by the data acquisition system during the test (edge computing, for example with imc Online FAMOS) and the original time signal was not stored at all, which is common to reduce the amount of stored data.
The result initially appears like a histogram, i.e. the count is plotted on the y-axis, the amplitude on the x-axis. If you want to swap the axes, convert the data set to an xy format using the function XYof.
To switch the “Count” axis to the common logarithmic scaling, a few clicks are sufficient, using the FAMOS curve window configuration assistants.
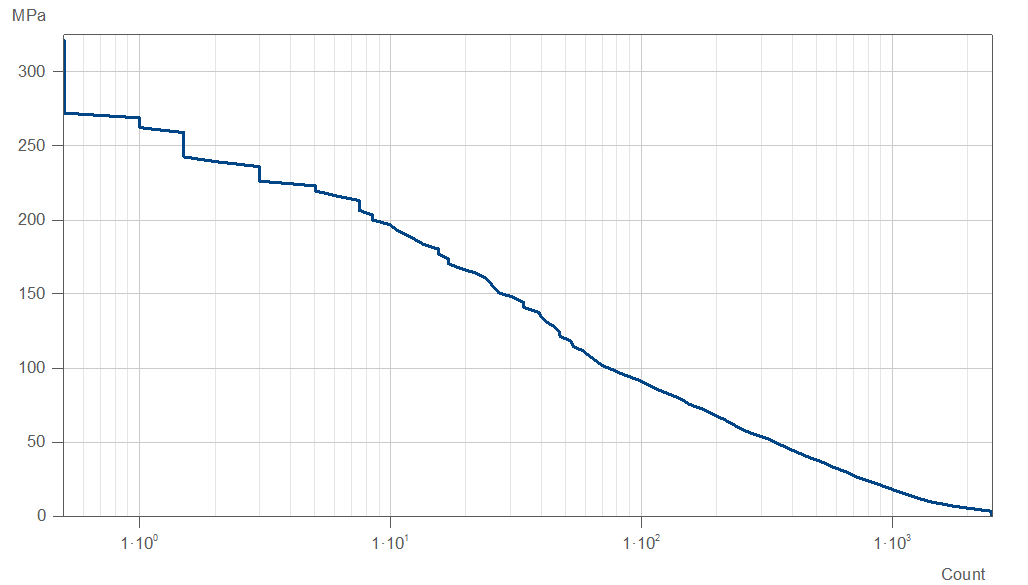
Range-Pair Analysis in FAMOS
The range-pair analysis is another counting method also known as cumulative cycle count calculation and is also standardised according to DIN 45667. The calculation recognizes positive ranges as signal sweeps subsequent to minima (valleys) and negative ranges as signal sweeps subsequent to maxima (peaks). A tally is only then occasioned, when a positive range is matched to a negative range of equal magnitude; in other words, when a range-pair has occurred. A small range-pair can be counted several times, before a larger one gets counted.
The result is a plot providing a good overview of what proportion of the load cycles are those with high amplitudes. The count is plotted cumulatively, so that the count at small amplitude is equal to the total number of all load cycles.
Similarly to the level-crossing function, FAMOS offers both approaches here: Calculating based on the time-domain signal, or based on a previously populated Rainflow matrix (incl. residue).
Damage calculations
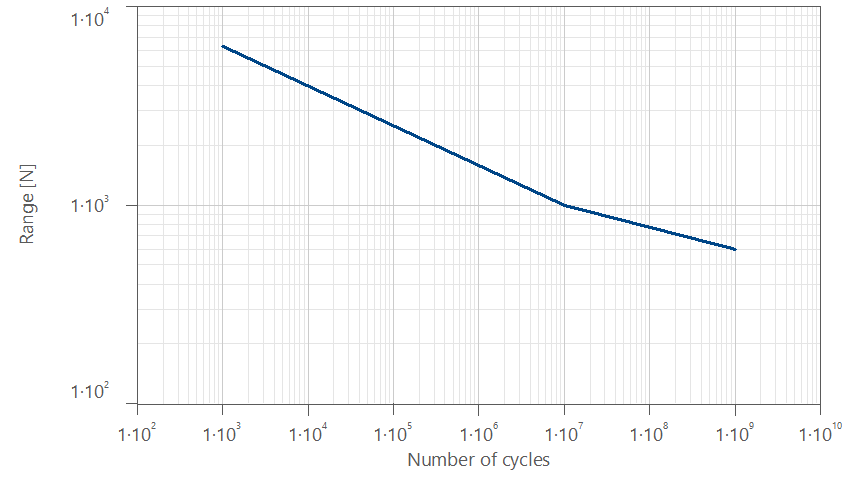
With the help of the Rainflow matrix and an S-N curve (Woehler line), the accumulated damage caused by the measured load cycles can be estimated statistically. This curve describes the property of the material to withstand a greatly different number of these cycles before it fractures, depending on the amplitude of the load cycles.
Since the damage increases exponentially with the amplitude, SN curves are usually visualized and interpreted as log-log plots (for metals). Depending on the type of material, the shape of the component, the direction of the load, and many more aspects, very different curves are used, which are either determined experimentally, taken from material databases or derived from models. An example of such a model is Eurocode 3 (EN 1993-1-9:2005 + AC:2009). It defines a whole series of curves for so-called categories of structural detail, or short detail category. A category of 56 means, for example, that a load cycle of peak-to-peak amplitude 56 MPa (or N/mm²) statistically produces a fracture after 2,000,000 repetitions. Of course, load cycles of other ranges also contribute to the damage.
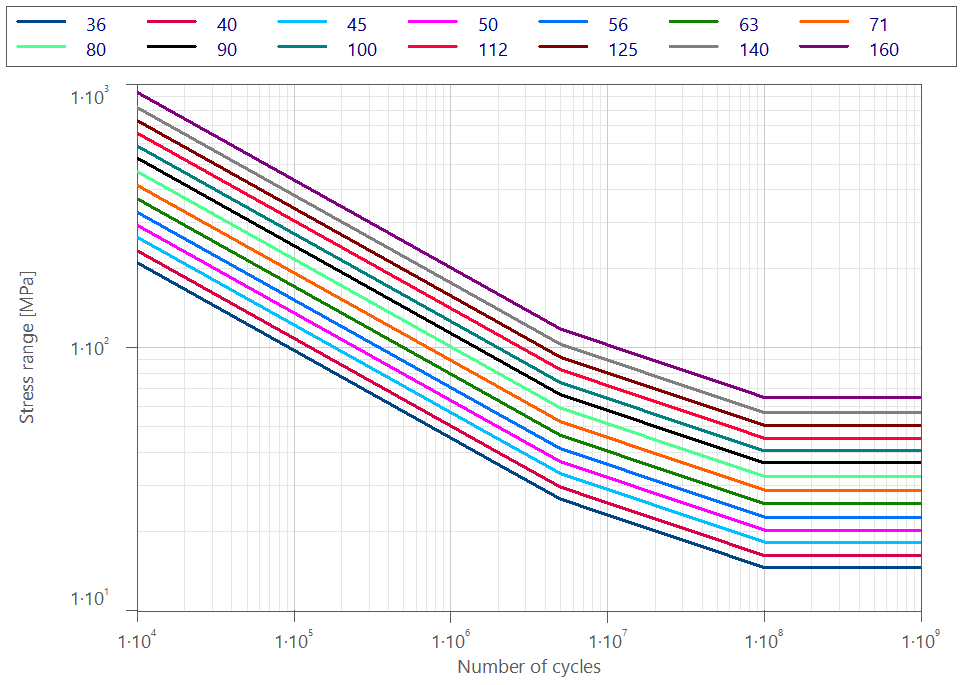
Since very small amplitudes do not produce micro-cracks, e.g. in steel, there is also an area in which the curves run horizontally, depending on the model. Load cycles below that fatigue limit then do not contribute to the damage calculation.
Defining an S-N curve in FAMOS only requires the few characteristic points where the slope changes. The ClsOffWoehlerSN function then correctly does the double- logarithmic interpolation in between. The included demo project "Durability & Fatigue" also contains examples of generation according to Eurocode3, BS7608:2014 and slope factor. The latter uses a slope K1, a range Seand a number of cycles Ne. Optionally, a second slope K2 = 2 × K1 – 1 can be activated for the fatigue limit area.
Amplitude Inaccuracy Compensation
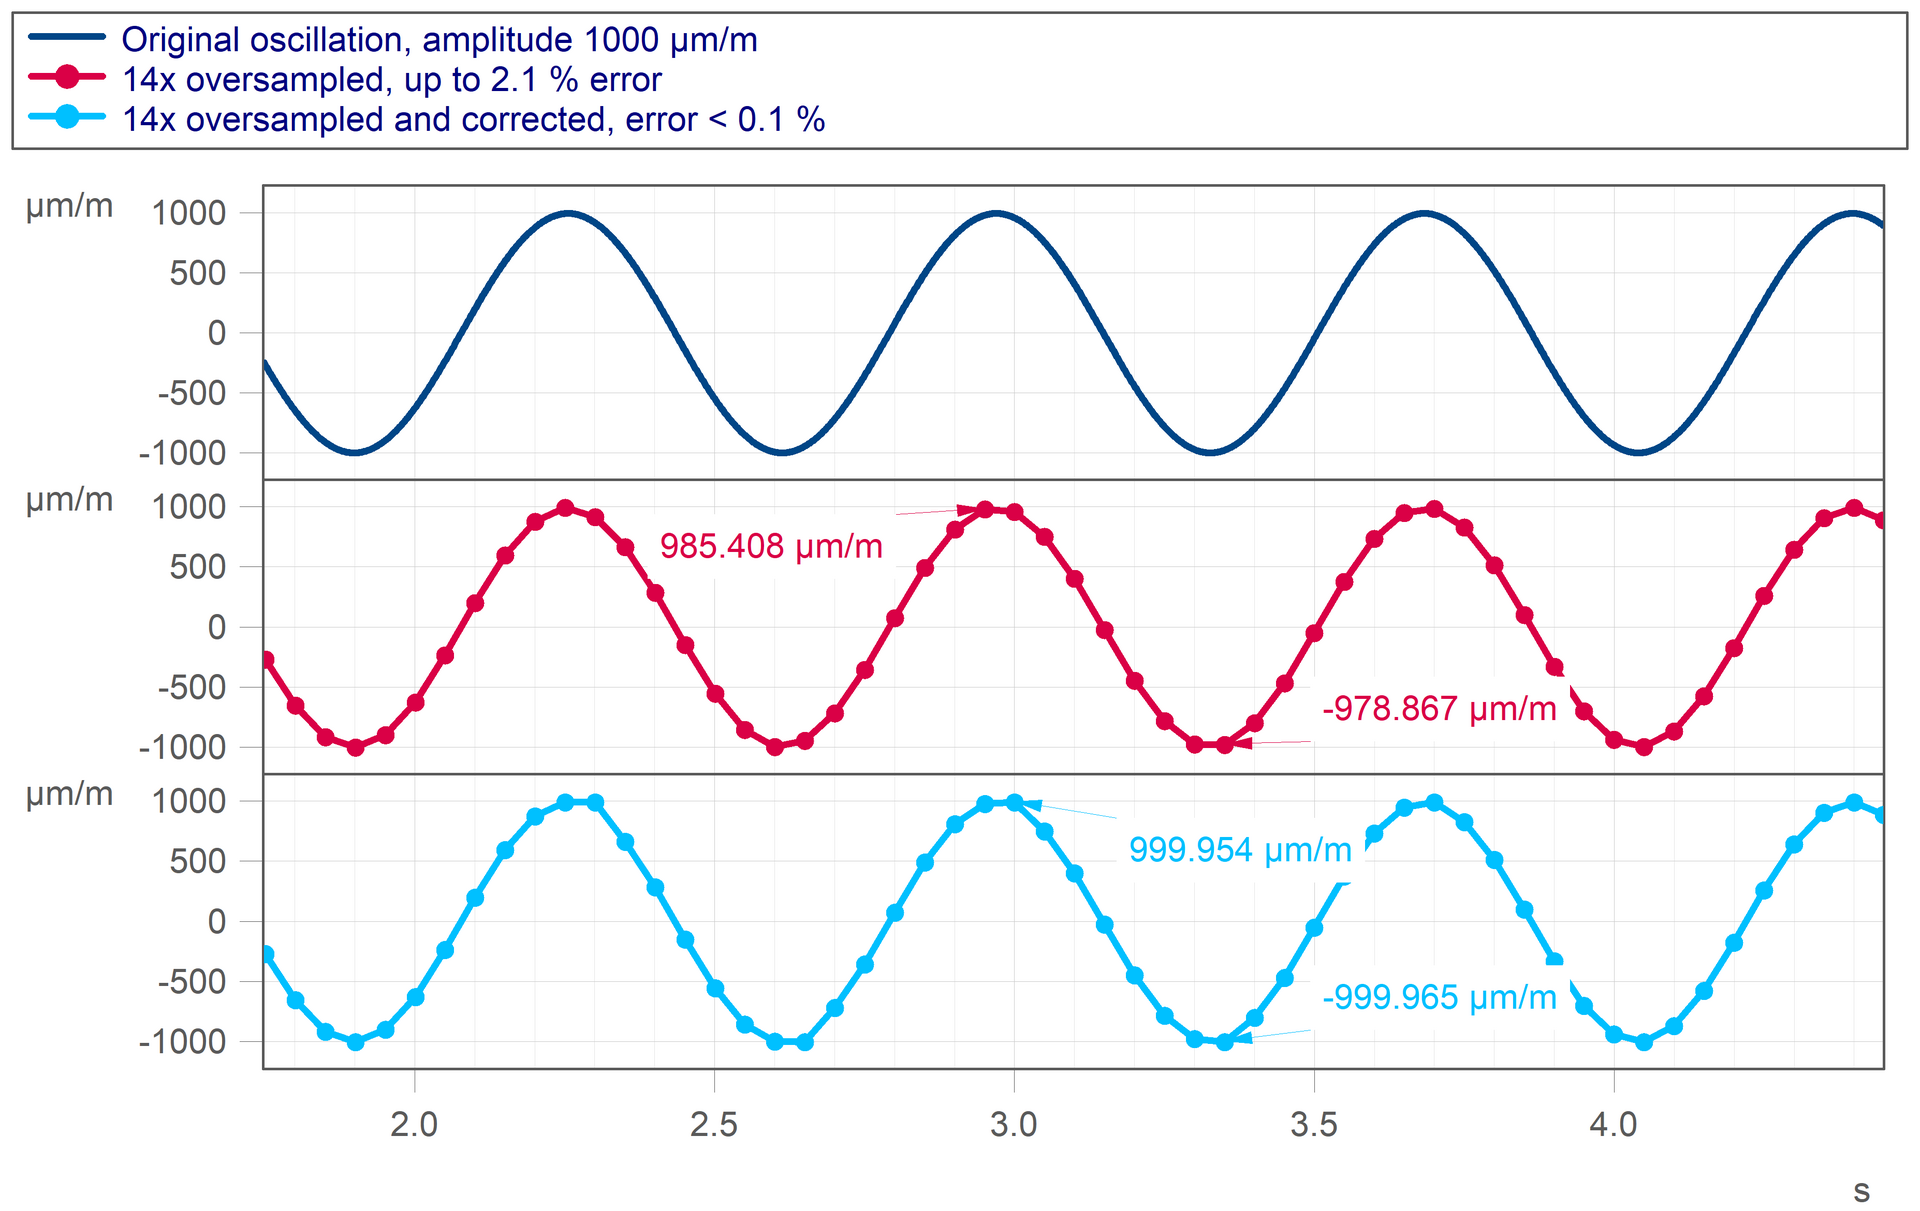
In contrast to NVH tests, the precise peak amplitude of the load cycles is crucial in fatigue analyses, while the frequencies contained in the signal are not considered. Since the damage grows exponentially with increasing amplitude, even small measurement errors have a significant effect.
One crucial source of these measurement errors is insufficient oversampling. The lower the ratio between the sampling rate and the frequency of the measurement signal, the less accurately will the sampling catch the timing of the peak values. Therefore, 100 times oversampling is common.
However, with the patented "imc TrueMax" algorithm, FAMOS offers a way to correct such sampling errors. In this process, a higher sampled signal curve is internally reconstructed and the peak (and valley) values in the time signal are shifted accordingly. The sampling rate is retained, and so is the amount of data.
For example, an oversampling of only 20 times can result in an error of up to 4%. After using the imc TrueMax function, this is reduced to less than 0.4%.
Further analysis functions
Depending on the application, various other calculation functions are relevant. FAMOS also provides the following, for example:
- Time-at-level histogram
- Power spectral density (PSD, power density spectrum)
- Range counting
- Markov matrix from signal transitions
- Reconstruction of a time signal from a Rainflow matrix, for feeding a shaker, with a caused damage equivalent to the original measurement signal’s and small and large load ranges evenly distributed over time
The demo projects "Durability & Fatigue" and "Class counting" are included as standard in FAMOS Enterprise as well as in the 30-day trial version and offer many starting points for your own analysis solutions.