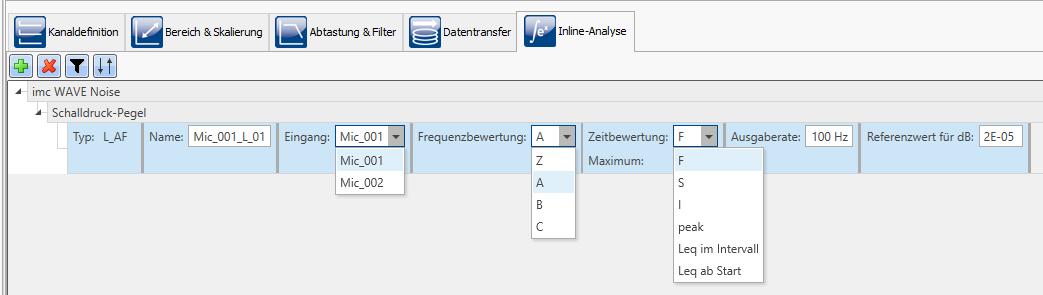
With the imc WAVE noise analyzer, you can determine the acoustic properties according to IEC 61672 Class 1 as a time-weighted and integrated sound level meter. The signals of several microphones can be processed in parallel, online and synchronously. The characteristics of a channel can be entered manually from the calibration sheet of the sensor or read in automatically via the TEDS chip.
Since, when measuring according to standards, a calibration measurement of the microphone must be performed before and after each measurement, which is a central function in imc WAVE noise. The measured value can be adjusted to the applied acoustic calibration value or simply a control measurement is performed. Both procedures are documented with the measurement channel. In addition to the sound analysis, the microphone signal can be calculated in the octave or third octave spectrum and as an FFT analysis in real time and displayed as a 2D or 3D diagram (waterfall).
As a further function, a complete sound power measurement according to ISO 374x is also available.
Free Webinar
Basics of vibration analysis on machines and drive
Register now to watch the recording
Online results
- A-, B-, C-, Z-weighting filter, Fast, Slow, Impulse, Peak and Leq
- Sound level meter according to IEC 61672, IEC 60651 and IEC 60804
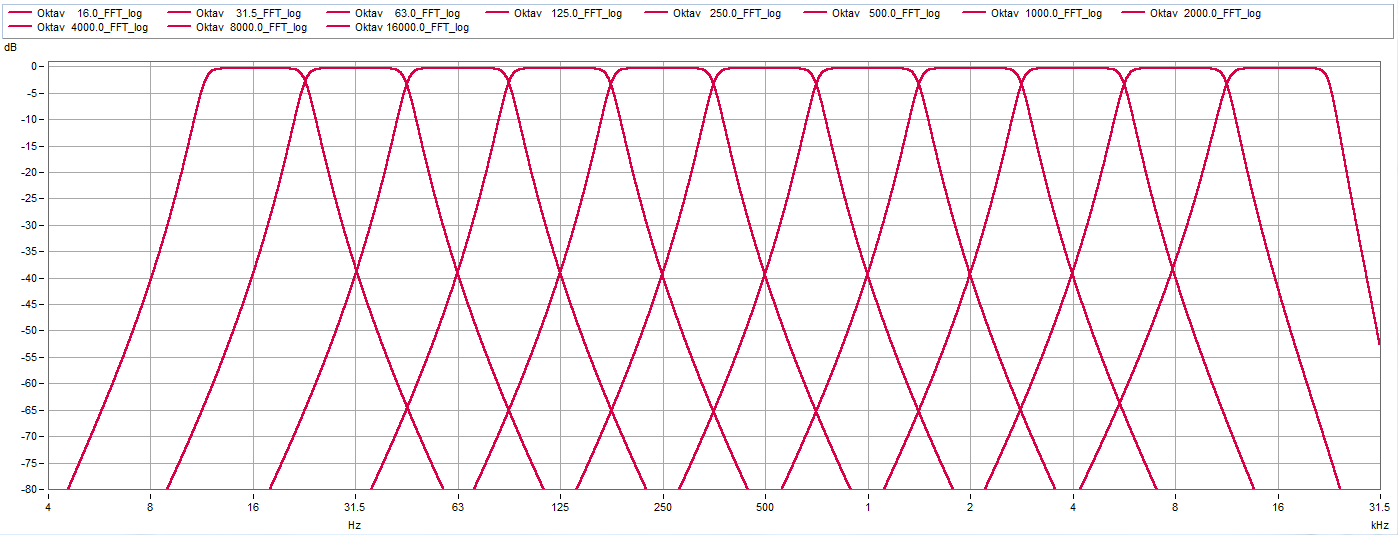
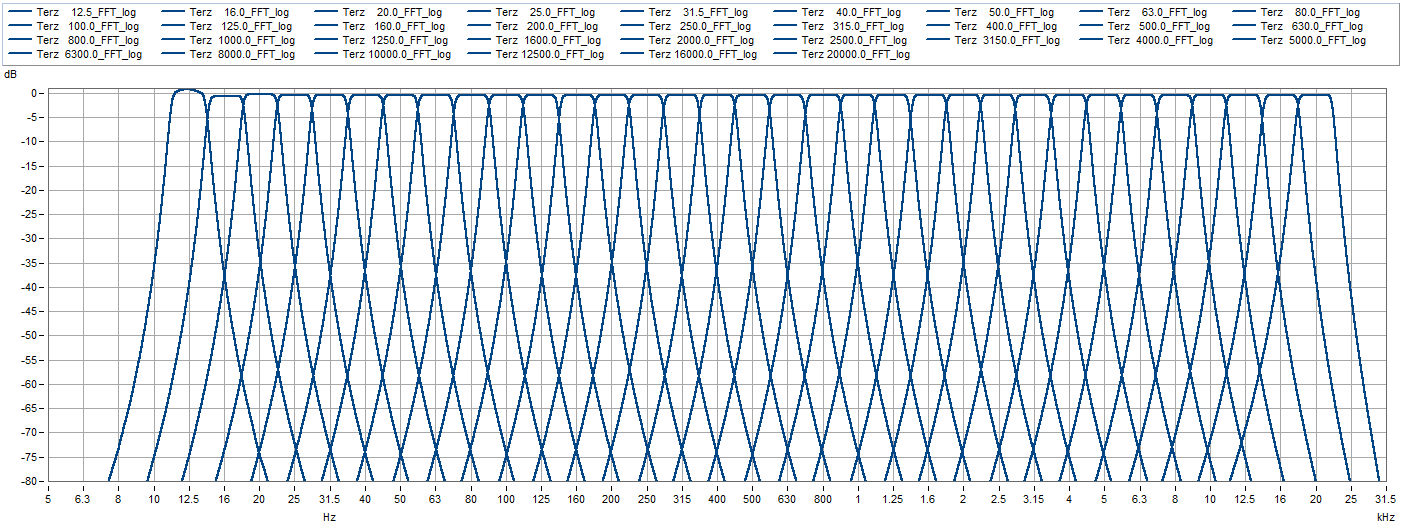
- 1/1-tel and 1/3-tel octave analysis according to IEC 61260
- FFT analysis (up to 131072 points)
- Sound intensity level with directional sign
- Sound intensity terc analysis
- Sound intensity FFT analysis
Offline result optional
- 1/12 octave and 1/24 octave band spectrum
- Loudness and loudness spectrum according to Zwicker ISO 532-1
- Sharpness or sharpness
- Articulation index
Typical applications
- Standardized acoustic measurements
- Acceptance and certification measurements related to noise emission
- Product qualifications
- Product optimization in the development area
- Noise comfort in vehicles: measurements for qualification and optimization
- Holistic investigations of causes, propagation paths and effects of sound and vibrations
- Contribution of acoustic expertise in general application areas of physical measurement technology
What does NVH stand for?
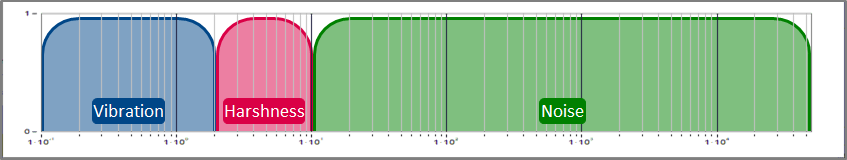
NVH stands for: Noise - Vibration – Harshness
Humans can hear vibrations as noise, feel vibrations or perceive harshness. The phenomena also merge into each other. When the frequency of vibrations ranges between 0,1 Hz to 20 Hz, these can be perceived by the human body and influence our well-being. If vibrations are somewhat higher in the frequency range, from approximately 20 Hz to 100 Hz, vibrations are both perceptible by the body and audible via the air and are classified as harshness. Since the perceptible vibrations decrease significantly from approximately 50-100 Hz, the frequency range from approximately
100 Hz to 20 kHz is referred to as noise, i.e. unpleasant airborne sound that we hear.
What is the sound level?
A sound level meter is a data acquisition system that records noise similiar to the human ear.
It provides results that are objective and reproducible. Therefore the sound level originates in change of the air pressure within a frequency range
of 20 Hz to 20 kHz, it can be recorded with a microphone and further calculated with frequency-weighting and time-weighting.
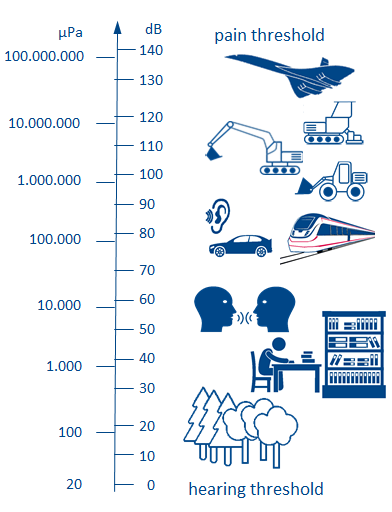
DIN-ISO 61672 describes the analysis and the method of data acquisition. Here, accuracy classes - class 1 and class 2, are give, that are dependable from the microphones used for test and measurement. The sound level is always in dB. The lowest sound that a healthy human can hear, is about 20 µPa at 1 kHz. This is less than one part in a billion of the normal air pressure, on which the sound signals are superimposed.
To reach the threshold of pain of sound pressure fluctuations, the sound is about 10 million times larger than the hearing threshold. In order to get a handy scale of the sound, the dB scaling has been introduced. Thereby the factor 10 in the sound pressure corresponds to an increase of the level by 20dB. Usually the sound level is labeled with an addition in parentheses, e.g. dB(A). The (A) stands for the weighting of the level. However, (B), (C) or (D) can also be written in parentheses, whereby the B-weighting is almost no longer used.The C-weighting is used for impulsive noise and the D-weighting for aircraft noise.
Why is there a dB-scale?
This is less than one billionth of the normal air pressure on which the sound signals are superimposed. To reach the threshold of pain of sound pressure fluctuations, the sound is about 10 million times larger than the hearing threshold. In order to get a handy scale of the sound, the dB scaling has been introduced. Thereby the factor 10 in the sound pressure corresponds to an increase of the level by 20dB. Usually the sound level is labeled with an addition in parentheses, e.g. dB(A). The (A) stands for the weighting of the level. However, (B), (C) or (D) can also be written in parentheses, whereby the B-weighting is almost no longer used.The C-weighting is used for impulsive noise and the D-weighting for aircraft noise.
What does frequency weighting mean?
frequencies are rated with four frequency weighting filters, A, B, C or Z.
A-rating:
for low sound levels of approximately 20-40 Phone (blue curve). Today, the A-rating is used in most cases. In favor of easy handling a better frequency response adjustment is dispensed.
B-rating:
for sound levels of approximately 50-70 Phone (red curve). B-rating is not used any more.
C-rating:
for high sound levels of approximately 80-90 Phone (orange curve). The C-rating is used in noise protection, when the A-rating has to be expanded when sound levels consist of impulsive and tonal noise.
Z-rating:
means without frequency weighting

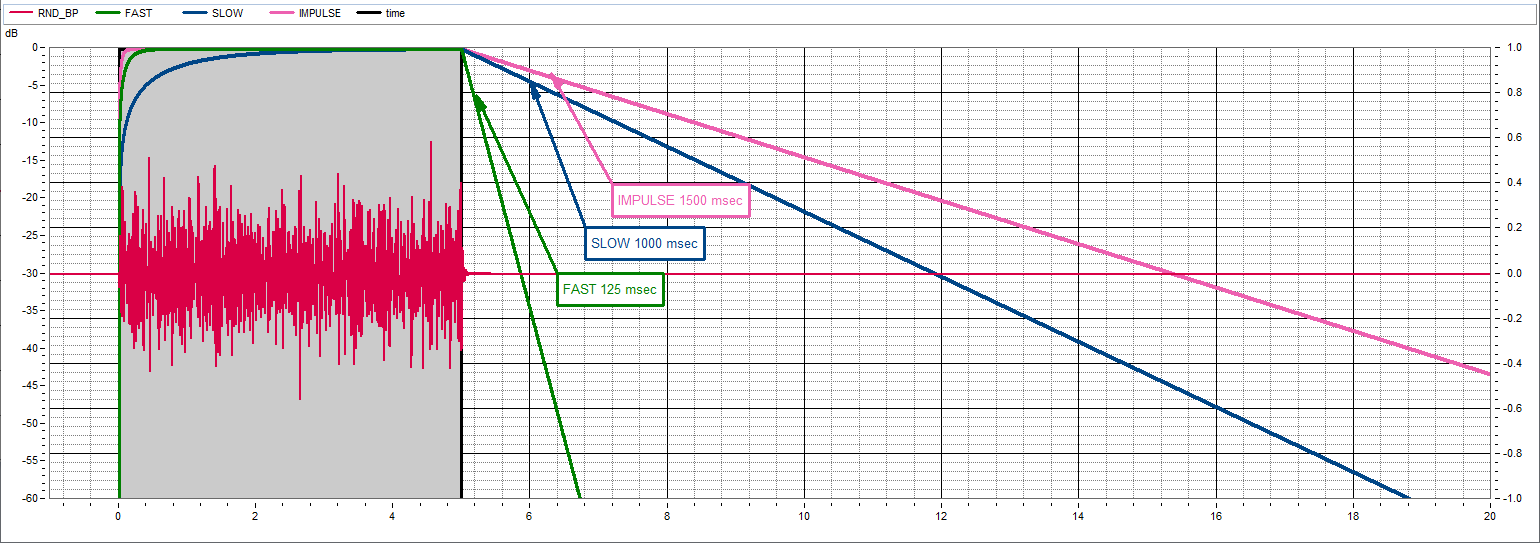
What does time-weighting mean?
The time weighting determines the floating RMS value of the frequency-weighted sound signal. It is a compromise between fast following of the fluctuating vibration signal and the readability of the measured value and is also called display inertia.
FAST-rating: Τ = 125 msec,
description FAST: quick increase and quick decrease of the signal.
increase time T = 63% decrease time T = 36% , decrease time: -34,7 dB/sec
SLOW-rating: Τ= 1000 msec
description SLOW: slow increase and slow decrease of the signal.
increase time T = 63% decrease time T = 36% , decrease time: -4.3 dB/sec
IMPULSE-Bewertung: Τincrease = 35 msec, Tdecrease = 1500 msec,
description IMPULSE: very quick increase and very slow decrease of the signal.
increase time T = 63% decrease time T = 36% , decrease: -2,9 dB/sec

What is frequency analysis?
A frequency analysis can be calculated narrow-band as FFT analysis or clearly laid out as as a third-octave and octave analysis. In frequency analysis, a basic distinction is made between two methods: third-octave and octave analysis or FFT analysis.
What is a one-third octave analysis?
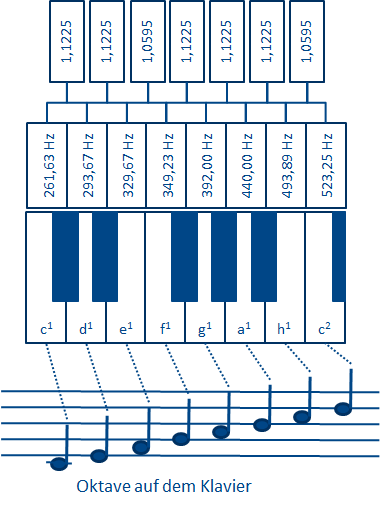
To get detailed information about a complex sound signal, more information has to be identified about the composition of the signal's frequency. The different frequencies can be best explained with a musical scale.
The octave [lat.], describes the interval of 8 diatonic steps away from the first note. In acoustics it denotes the tonal sound that has twice the frequency, related to a first sound. Since antiquity, the representation of the western tonal system has been based on the octave. The third octave analysis (third [lat.], the third tone) is a frequency analysis with relatively constant frequency resolution, i.e. that the center frequency fm of a bandpass filter in relation to the bandwidth (fB=fO-fU) is the same for all frequency bands. The upper cutoff frequency fO and the lower cutoff frequency fU of a bandpass filter are at an amplitude attenuation of -3 dB (factor 0.707). The relative bandwidth of the octave is fB = 0.707, the third octave is fB = 0.23 and the 1/12th octave is fB = 0.059.
The one-third octave spectrum allows an evaluation of the spectral line distribution, for example of a sound signal. Its advantage is the ability to rate the logarithmic frequency of the human ear. The one-third octave filters roughly correspond in their bandwidths to the frequency groups that reach the discriminating ability of the ear. Because of this, their discriminating power is sufficient for many psychoacoustic problems, including loudness determination.
A frequency analysis can be calculated narrowband as FFT analysis or clearly represented as third octave and octave analysis.
What is a FFT (fast fourier transform) analysis?
The Fast Fourier Transform (FFT) is a fast computational algorithm for calculating the discrete Fourier transform (DFT). The algorithm developed by James Cooley and John W. Tukey (1965) uses computational advantages that arise with a number of 2 to the power of N values.

In modern analysis software packages, one is no longer dependent on the number of values of 2 to the N, because if the number of FFT points is not a power of 2, the signal is interpolated to the corresponding higher sampling frequency.
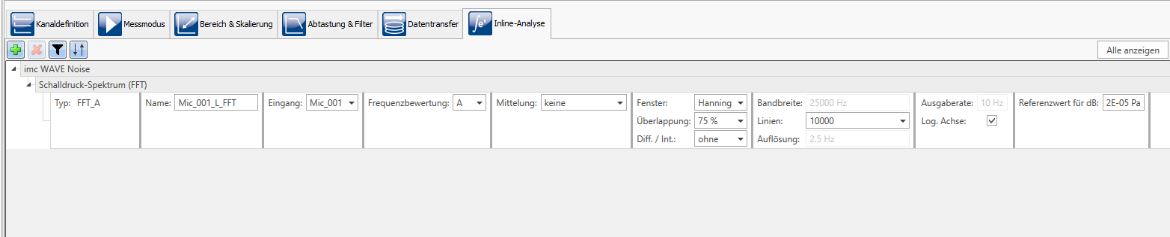
In this way, various parameters can be set with imc WAVE.
- Frequency weighting: A, B, C or Z
- Averaging: none, Leq from start
- Windows: Rectangle, Hamming, Hanning, Blackman Blackman-Harris and Flat-Top
- Overlap: 0%, 10%, 25%, 33.33%, 50%, 66.66%, 75%, 90%
- Diff./Int.: differentiate, dual differentiate, integrate, dual integrate.
- Points: 128.....131072
- Log.axis: Yes / No
- Reference value dB 20 µPa = 2 E-05 Pa
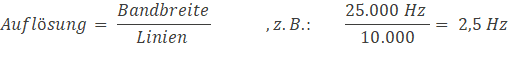
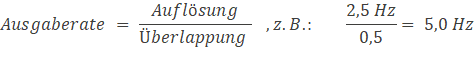
- Display of: Bandwidth, resolution and output rate