
The New Data Analysis Software
imc FAMOS 2024
The new version of the imc FAMOS 2024 data analysis software introduces new and revised functions. These enhancements make it easier for new users to get started and enable experienced users to work more efficiently. They include the new start page, extended functions such as polar diagrams, enhanced text display, and a new function for performing calculations directly in the curve window.
New Start Page
The new start page allows direct access to actions, tools, templates, wizards, and demo projects. Furthermore, essential functions can be grouped as favorites to optimize workflows through faster access.
Elements of the new Start Page
Favorites
The content of the Favorites page can be compiled from the elements in the areas below. It is designed by default so that beginners can find their way around more efficiently, and experienced users need fewer clicks to get to the desired area.
Actions
Under the "Actions" menu item, all crucial entries from the "Open" and "New" menus can be executed via shortcuts.
Tools
The "Tools" menu item provides panels, dialogues, or projects; some typical FAMOS tasks can be carried out directly here without calling up sequences or curve windows. Settings and customizations can also be transferred directly to other computers on which FAMOS is installed.
Templates
Templates can be used to develop new sequences, panels, or projects. In contrast to tools, templates can only be executed after some adjustments have been made to the operating environment.
Wizards
Prepared wizards help FAMOS users get started with more complex applications in IMC FAMOS. They guide you through creating sequences and generating smaller code snippets. The results can be customized and extended for further use.
The following wizards are currently available:
- EXCEL: The wizard creates an Excel export template. This can be used to export data records in XLSX format. The settings of the export template determine the format of the Excel table created.
- Python: The wizard creates a sequence function to execute a Python script.
- ASCII/CSV/EXCEL: The wizard supports importing files from a column-oriented ASCII or Excel file.
- Execute R script: The wizard creates a sequence function for parameterizing and executing an R script.
- Calculate at the touch of a button: The wizard creates the basic structure for a simple evaluation. The selected data is displayed in a curve window in a panel. A configurable calculation can be carried out at the touch of a button. The results of the calculation are also displayed in a curve window.
Demos
The demo projects supplied can be accessed via the Start Page.
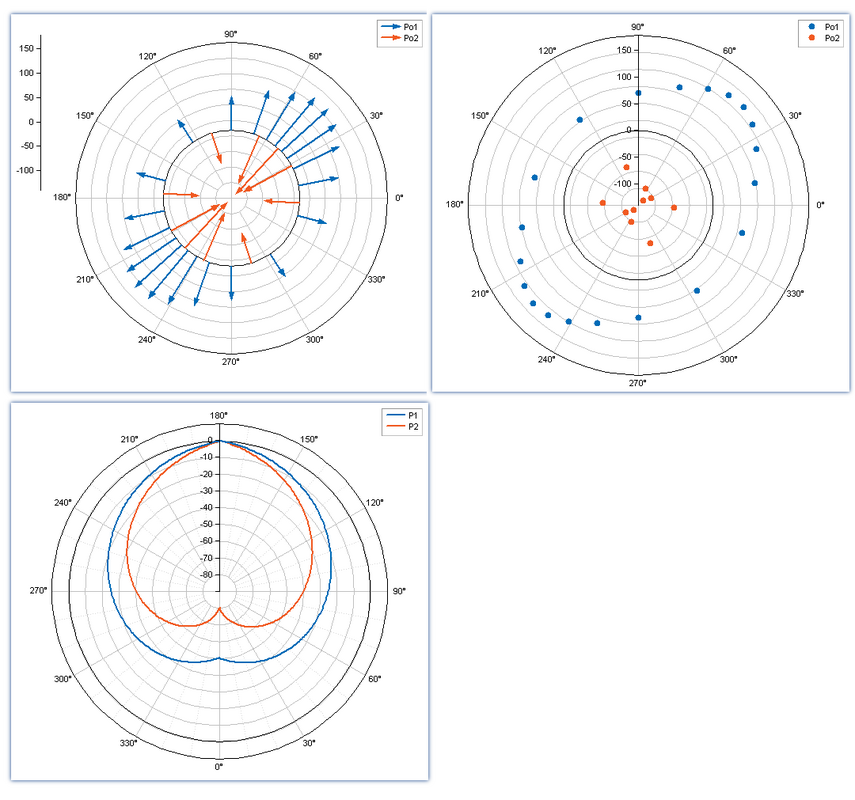
Enhanced Polar Diagrams
The display and functionality of the polar diagrams have been enhanced for improved use in wind turbines, acoustics, shaft vibration, and the balancing of rotating structures.
Negative Value Range
The polar diagram can now also be scaled into the negative range. This allows mechanical forces in tension and compression and classic dB acoustic diagrams to be displayed.
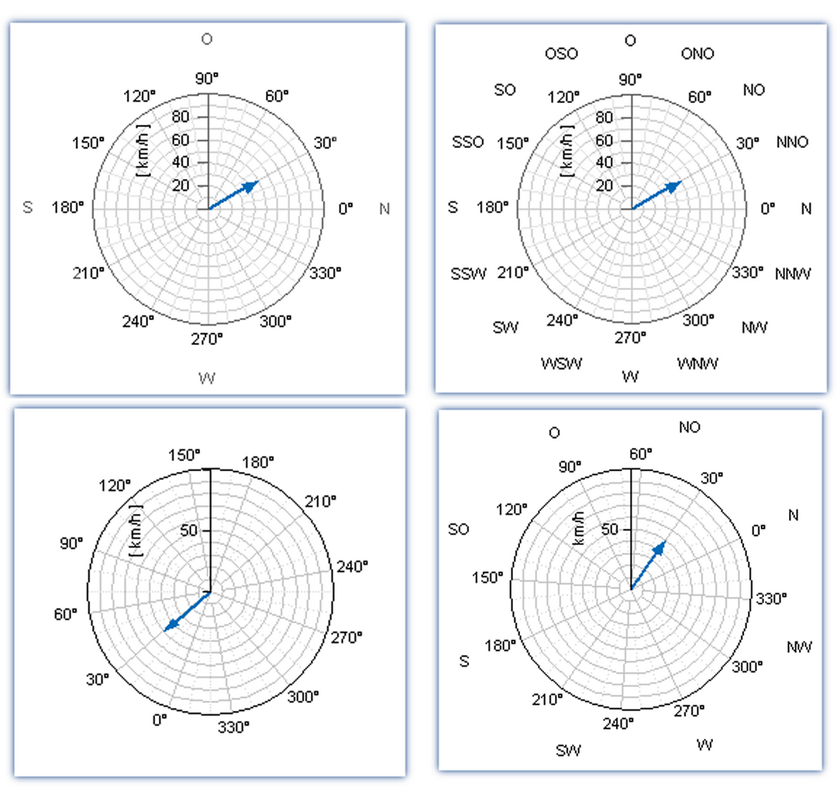
Display and Position of the Cardinal Point
Polar diagrams can be supplemented with four-, eight-, or 16 abbreviations for the compass direction. The orientation is freely selectable so that 0° can be at the top and 45°, as is usual with orbit plots. The direction of rotation can also be reversed.
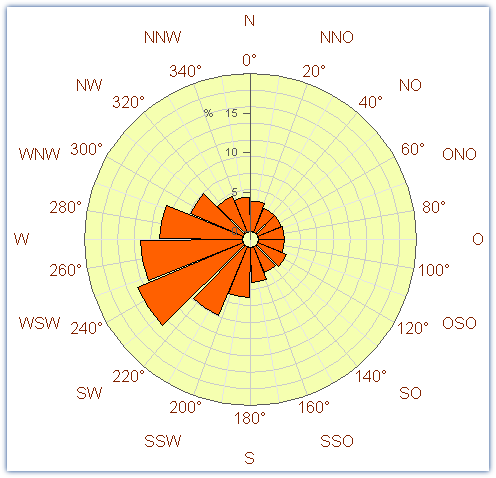
New Curve Type: 'Rosette'
The new "Rosette" curve type is suitable for displaying a distribution. Similar to a circular histogram display, focal points can be clearly emphasized.
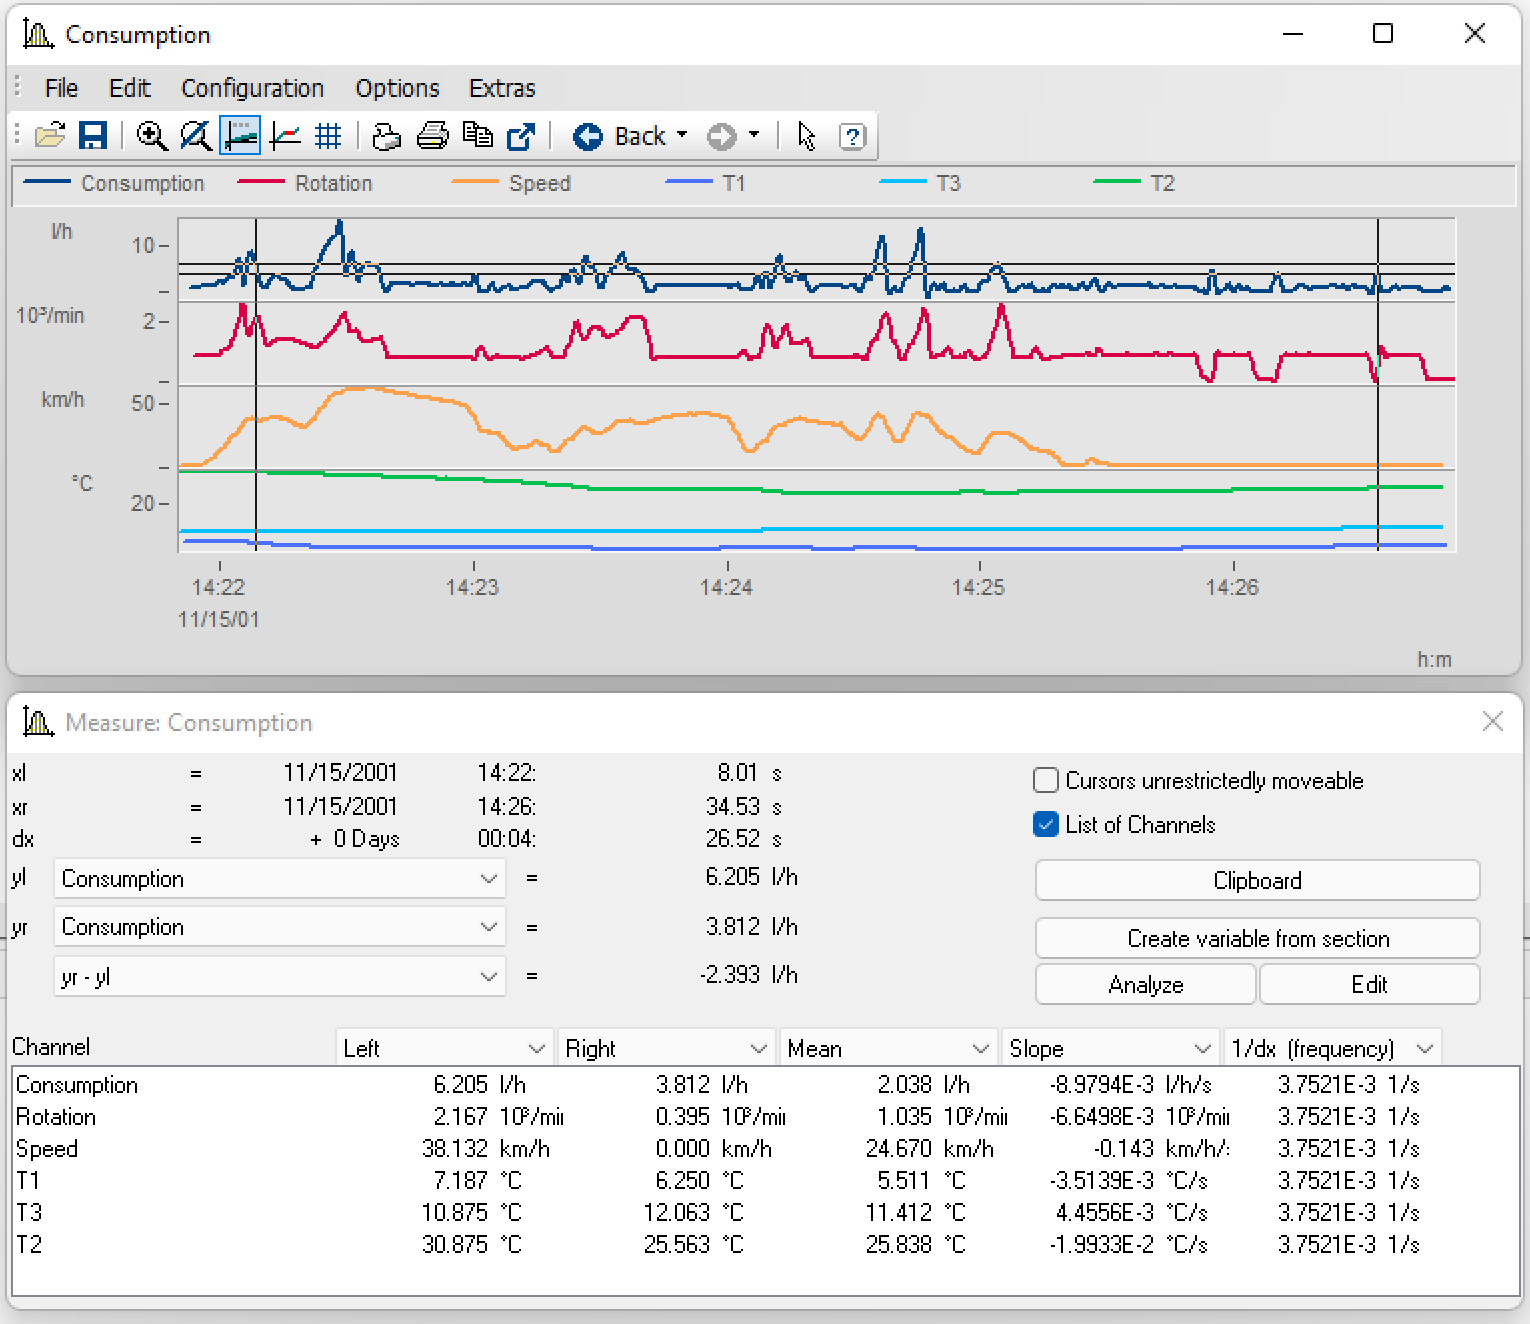
Calculations Directly in the Curve Window
Single Value Calculations
Calculations that result in a single value per data set (e.g., RMS, slope, max) can now be displayed simultaneously for all channels. The results of five calculations can also be displayed simultaneously. The tabular display in the "Measure" window has been expanded. As usual, the results are updated immediately when the cursor is moved. The results can be copied directly to the clipboard in an Excel-compatible manner.
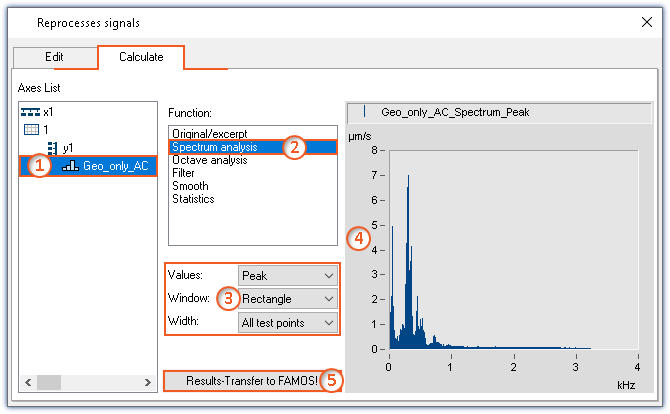
Parameterizable Calculations
Analyses resulting in a data set are also possible directly in the curve window. This enables the display of, for example, frequency content, PSD, or the histogram of a signal in the shortest possible time.
All you have to do is select the calculation type ❶ and the calculation configuration ❷. The result is immediately displayed in an additional curve window ❸. These calculations are updated immediately when the cursor is moved so that only part of the data can be analyzed.
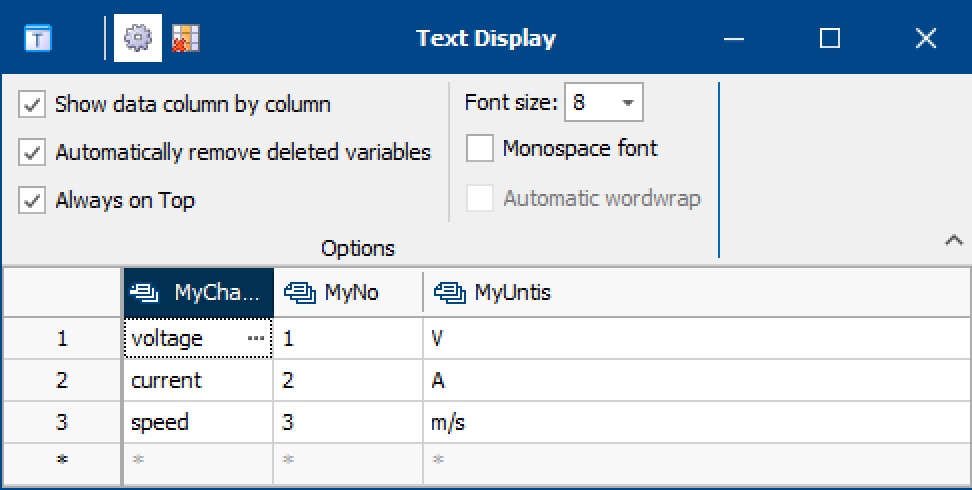
New Text Display functions
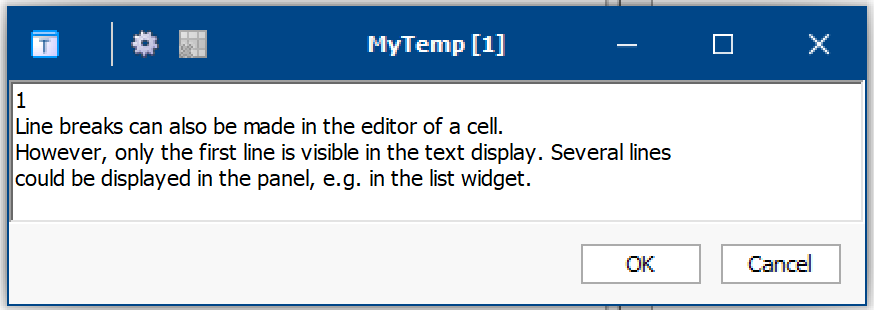
A new window is available in which several text variables can be displayed together. The variables can be displayed one below the other or next to each other. All fields of the text variables are also displayed accordingly. The texts can be edited, and additional fields can be added to the arrays.
A separate editor is available for multiline texts, which makes input easier.
Simplified Operation
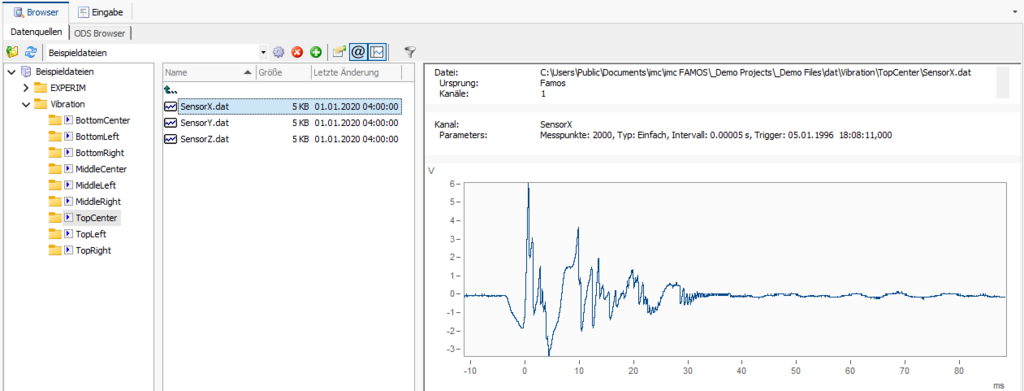
Preview Function in the Data Browser
Like the integration in Windows Explorer, a data preview is now also displayed within imc FAMOS when a file is selected with a mouse click. Therefore, FAMOS users can ensure that the correct measurement has been selected before loading.
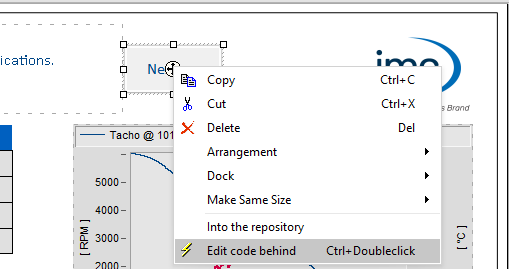
Easier Sequence Creation for Panel Pages
When inserting buttons into panel pages, it is possible to jump directly to the correct position in the sequence using the context menu. In addition to switching the design mode, imc FAMOS also remembers where you last worked so that you can easily continue working.
In addition to buttons, all other corresponding widgets, such as sliders or switches, also support this function.
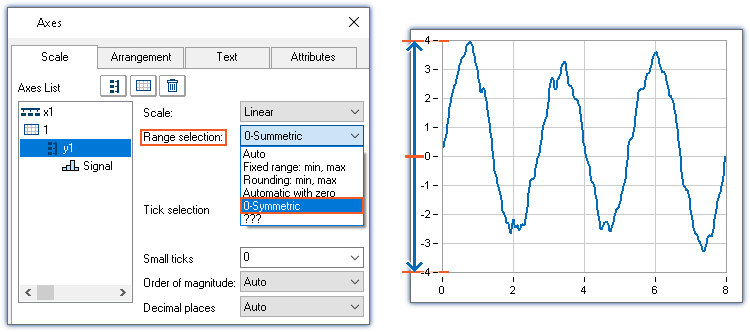
Axis Scaling
Automatic Scaling Symmetrical to the Zero Point: When comparing signals that fluctuate roughly around the zero point, it is often necessary to switch between measurements. Still, outliers often cause jumps in the automatic axis scaling and make it difficult to assess the results. For such cases, the axis center point can now be permanently set to "0". With this automatic scaling, the two limits for minimum and maximum are adjusted symmetrically to the absolute maximum value. This stabilizes the display noticeably.
This setting can also be activated for the Quickview window via the option: "Scale y-axes symmetrically by 0".
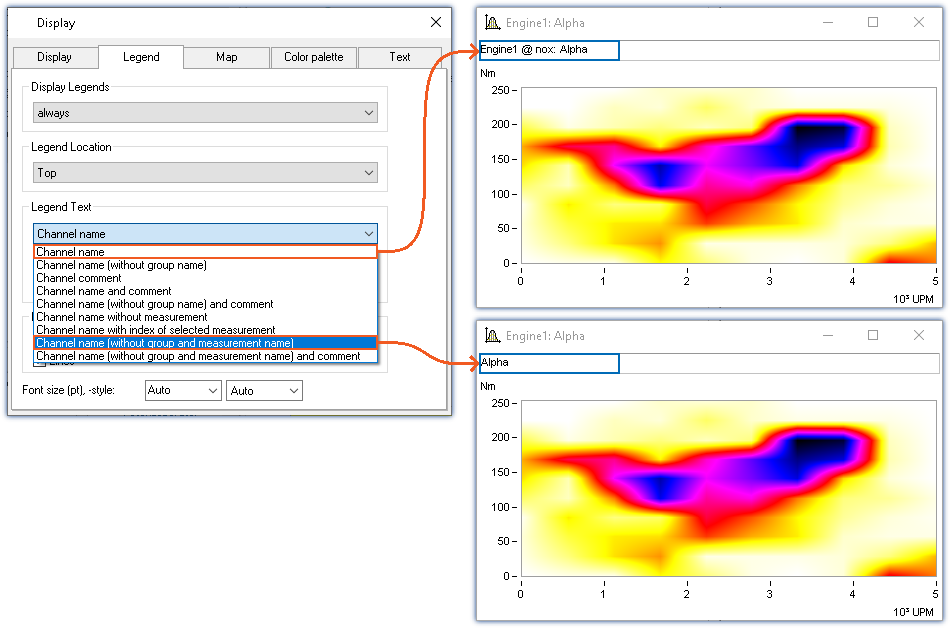
Channel Name in the Legend
There are two new options for displaying the channel name in the legend. Group names and measurement names can now be hidden together. New selections include: "Channel name (without group and measurement)" and "Channel name (without group and measurement) and comment".
All new features
You can find all new features in the detailed "What's new?" guide.

Older Versions
Contact us
imc Test & Measurement GmbH
Voltastraße 5
13355 Berlin (Germany)
Headquarters | info@imc-tm.de
France | hotline@imc-france.com
USA | accounts@imcdataworks.com
China | cnsales@imc-tm.com
Spain | info@imc-tm.es
South Korea | hotline@imc-tm.kr
Switzerland | info@imc-tm.ch
Netherlands | info@imc-benelux.com
© imc Test & Measurement GmbH. All rights reserved. Privacy. Incident Reporting. Company Information.