imc FAMOS Gallery
In this picture gallery, you can get a small example of the scope of imc FAMOS. Or, if you would like to test the software out for yourself, you can download the demo version with full functionality.

Integrate video and audio data
Easily link video and audio data with your measurement data, thus utilizing this additional information for evaluation. Using the tracking cursor, measurement and video data can be combined for frame-accurate analyzing.

Import data at the push of a button
imc FAMOS supports a wide range of common data formats such as Excel, binary, ASCII, MATLAB, etc. In addition, numerous import filters allow direct loading of different formats.

Personalize your own user interface
The imc FAMOS user interface view provides quick and easy access to all of the necessary tools you need for customization. The interface arrengement can be freely designed. By using Drag & Drop, personalized tool lists can easily be inserted into specific tool windows.

Create your own display elements
With the integrated Data Browser, you can simultaneously display measurement series overviews, analyses and documentation. And with the imc Panel, you can create personalized displays and report pages.

Messreihene sichten und vergleichen
Mit dem integrierten Datenbrowser lassen sich komplette Messreihen komfortabel sichten, auswerten und dokumentieren. Selbst umfangreiche Messkampagnen mit vielen hundert Einzel-Messungen sind in sekundenschnelle per Knopfdruck geladen. Besonders praktisch: einzelne Messungen können als Referenz markiert und mit den restlichen Messungen verglichen werden.
The imc FAMOS Curve Window
Presenting and displaying the measurement data is one of the outstanding functions of the imc FAMOS software program. The imc Curve Window offers a large variety of display features, such as 2D, 3D, figures, tables and bar displays. Adding curves per Drag & Drop, cursor functions and unlimited zooming are completely within the scope of functionalities, as is creating labels and legends. In addition, command sequence functions in the Curve Window can also be automated.
Operating the imc FAMOS Curve Window
The Curve Window is the most visual part of imc FAMOS; while there are many display types, the Curve Window remains easy to use with dialog driven configuration and toolbars for most common functions. While the number of possible Curve Window appearances is virtually unlimited, all Curve Windows use a common set of controls to define data contents and adjust line, symbol and color properties.
Easy and intuitive operation
Markers, individual Y-axes, overlapped or stacked curve displays are easily created per drag & drop. Different sampling rates and trigger times are handled by the Curve Window automatically.
Adding curves per Drag & Drop
Every variable can be easily inserted into the Curve Window per Drag & Drop. Through the menu items "Additional data sets", "axes" and "Display options", you have full control when managing multiple curves in one window.
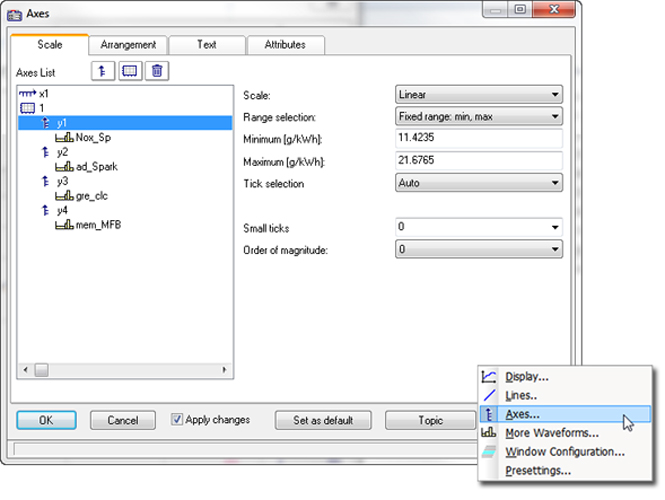
Complete control over the Curve Window
There are a variety of setup possibilities in the Curve Window. For example, each axis can be adjusted individually with respect to scaling, minimum, maximum, distance ticks, etc. In addition, line style, image and map overlays, display options, event/segment presentations, as well as many other Curve Window preferences are available.
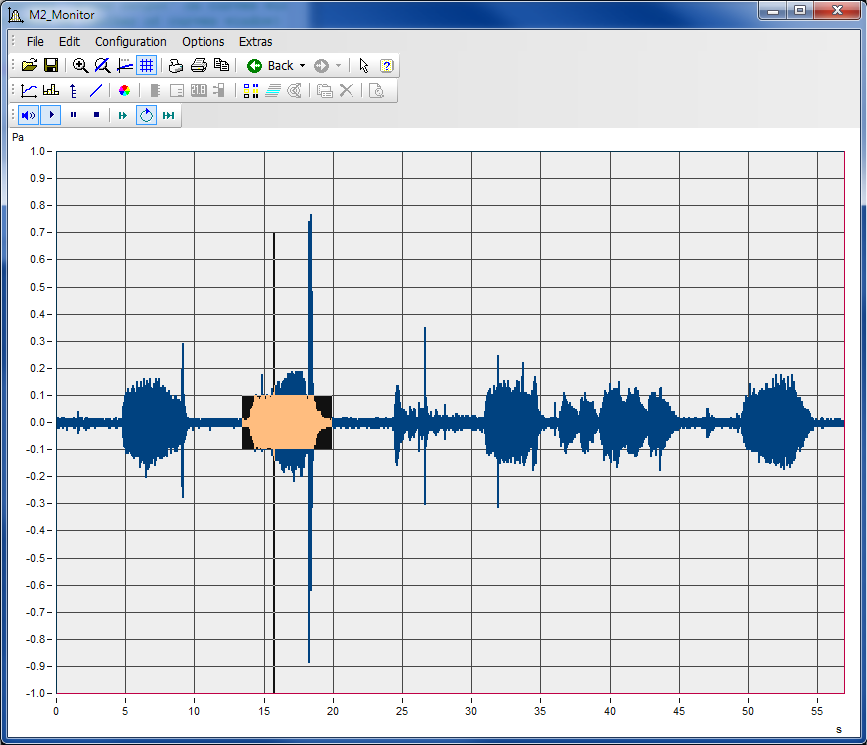
Audio data playback
Listen to your data! The sound playback toolbar allows you to mark a range of data with your mouse cursor and then press the play button to hear your data. Very useful even for non-audio data, as the human ear is excellent at picking out patterns.
Single value and 2D display possibilities
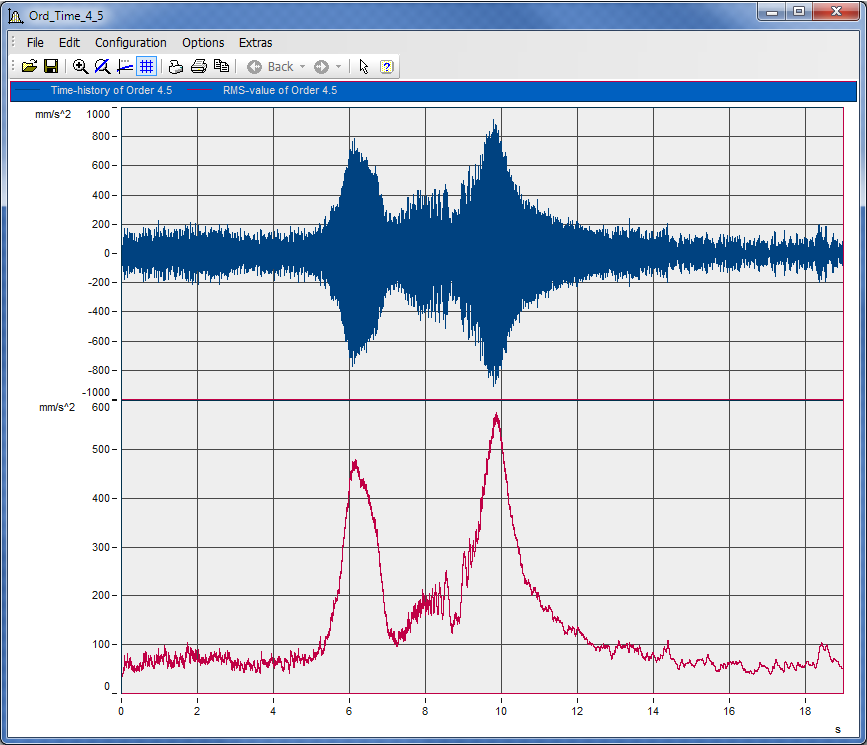
The most commonly used display of measurement data is two-dimensional: measurement data over time. Of course, the horizontal axis doesn't always have to display time. Frequency, order or any other waveform can be used as the x-axis in an XY display. Furthermore, it is also possible to display multiple curves with only a single x-axis. There's no need to worry when using different sampling rates and trigger times for your data - the imc FAMOS Curve Window automatically provides the correct display of the data.
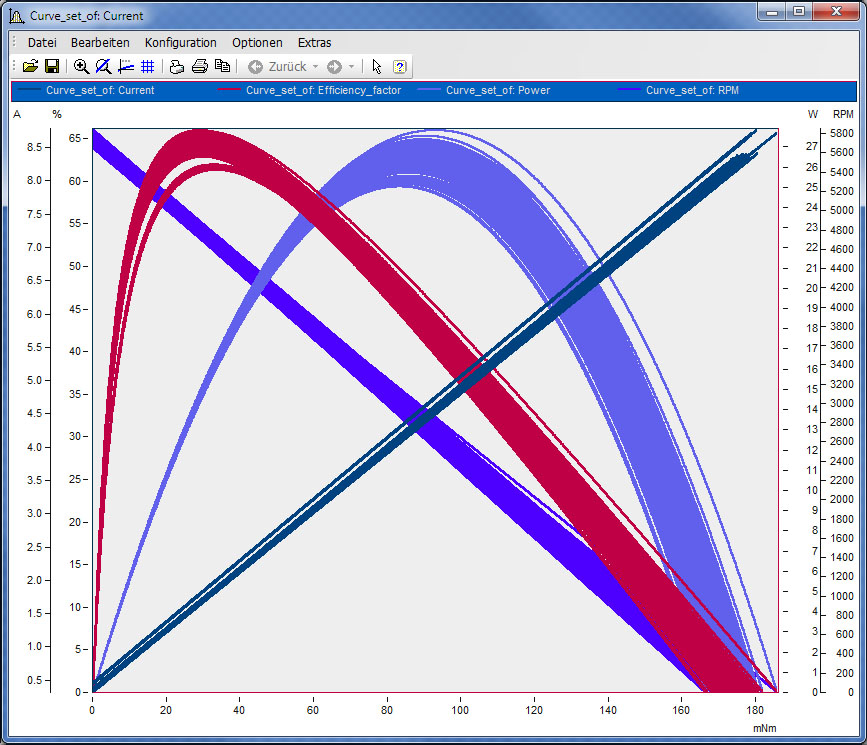
y-t or y-x displays
y-t or y-x: with imc FAMOS, you don’t need to worry about displaying data with different sampling rates or trigger times, as the Curve Window handles these issues automatically.

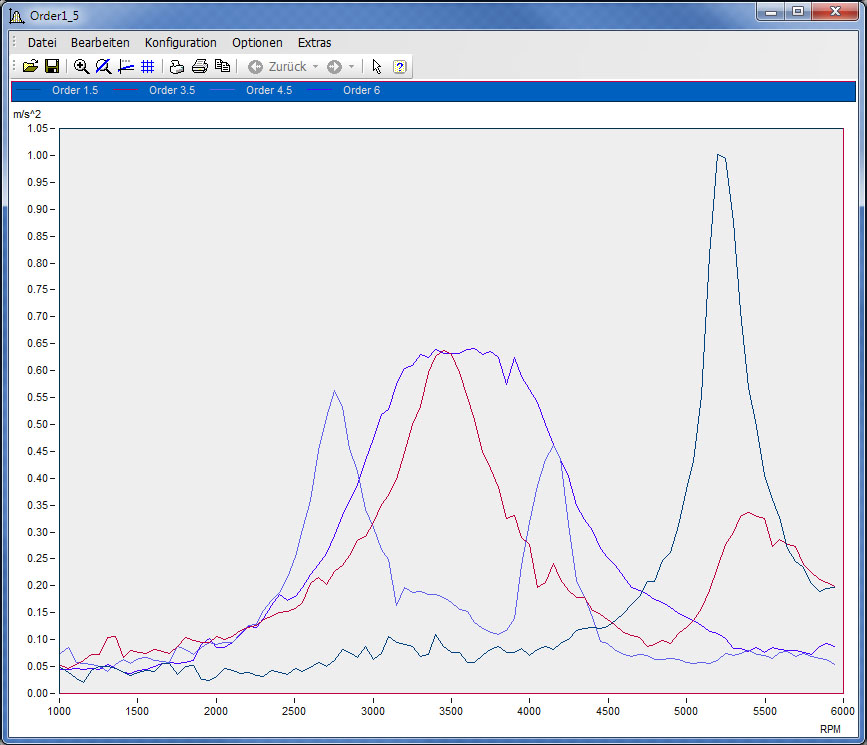
x-y displays
Any variable may be plotted against another in an "x-y" display; here (see graphic on right), the measurement of a chemical reaction rate versus concentration is shown in an x-y display.
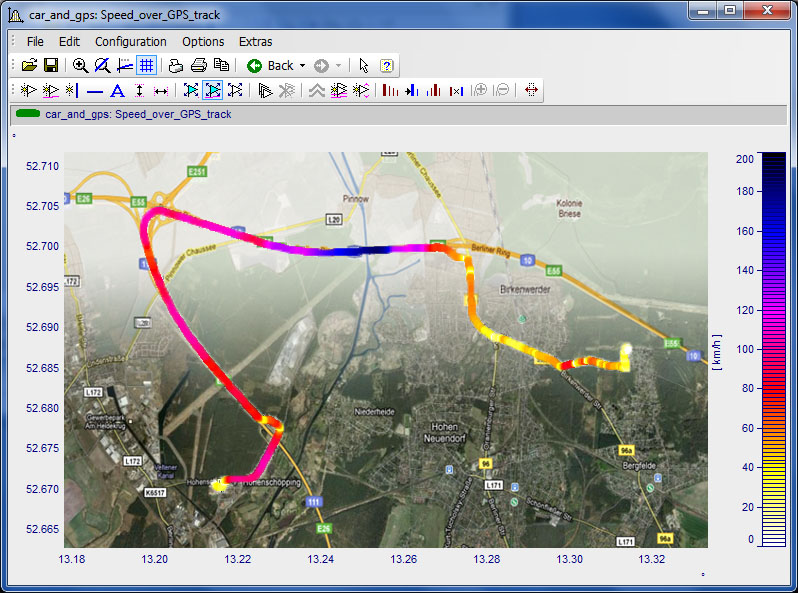
Overlaying of maps
Overlaying position data on graphical maps, such as Google Maps provides a useful combination between GPS data and recorded measurement data anywhere in the world. Here (see graphic on right), positions are shown with a color scale corresponding to speed.
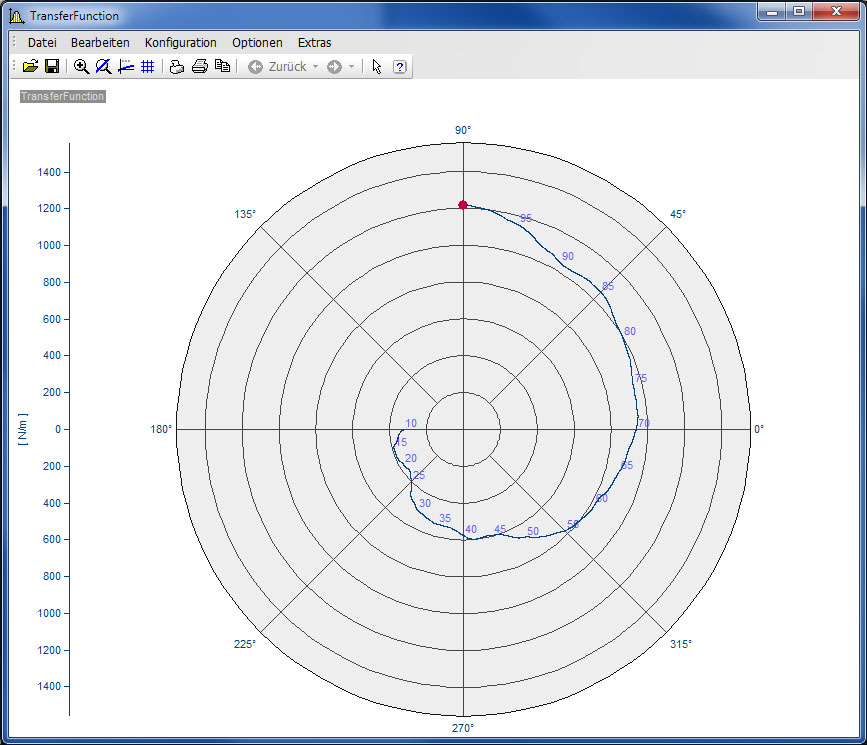
Locus plots
Locus plots represent two dimensional magnitude / phase information, as is commonly used to represent transfer functions.

Vector diagrams
Vector ("pointer") diagrams are a common representation for power quality and multi-phase power analysis.
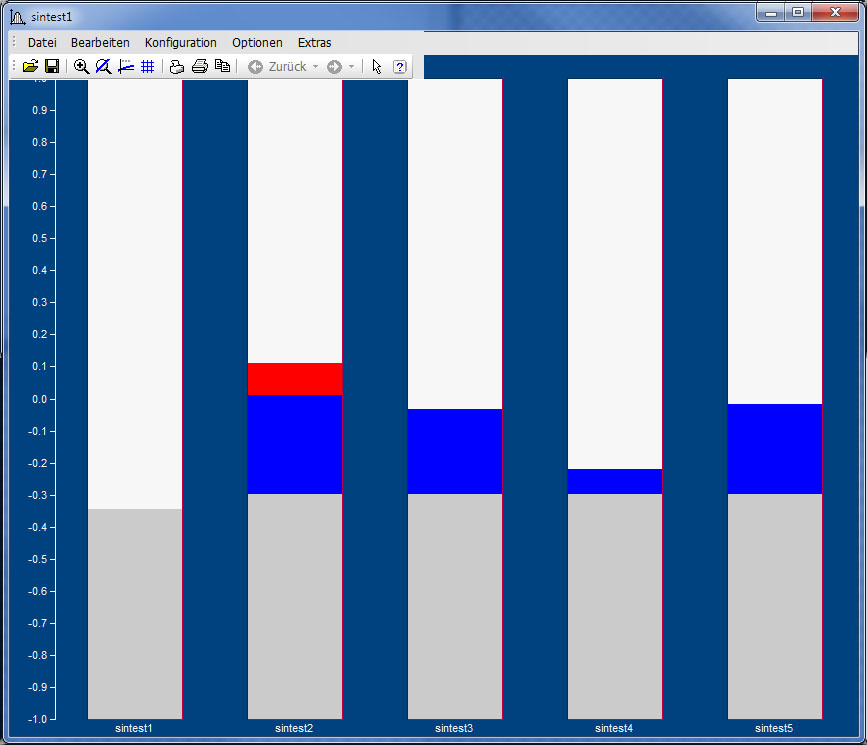
Bar displays
Representing data as a one dimensional bar is a common technique for providing a quick, graphical overview. Especially in the Data Browser, bars with amplitude specific colors and max/min slave pointers can provide exactly the summary information you need - for example, showing a mean or last value of a test parameter and colors indicating "in range".
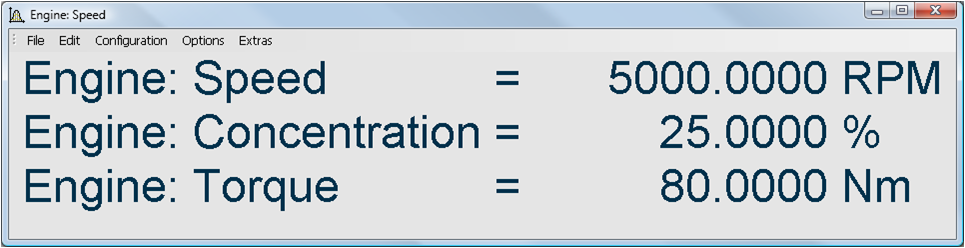
Single value displays
The "one-dimensional" display shows last value information or any single value result. Automatically align decimal points and apply units as desired to provide "bottom line" numerical information.
3D display forms
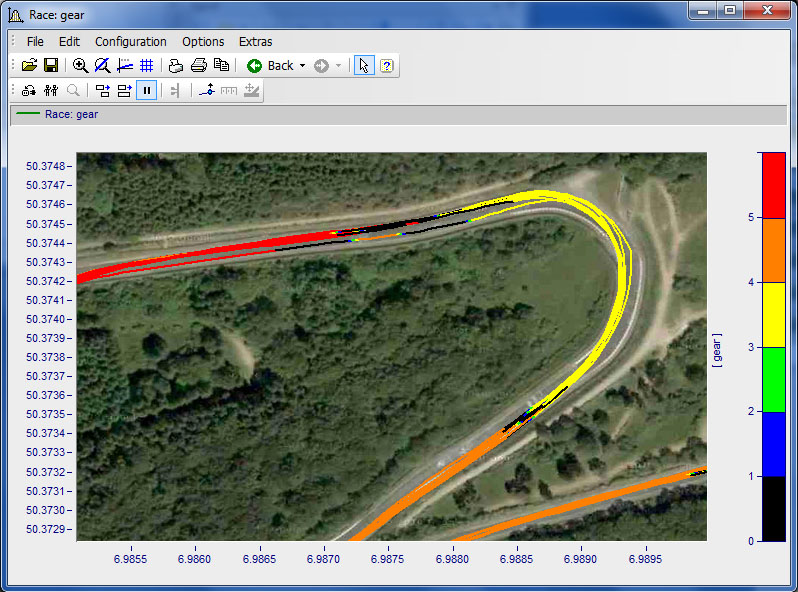
Colered lines depending on 3D
A color line is the simplest form of a 3D display; a 2D plot, such as the x-y plot of GPS position overlaid on a street map, can be enhanced with an amplitude dependent color from a third channel. In this case (see display on right), the current vehicle gear is represented in the color scale as the car repeatedly enters a tight curve on a race course.
Waterfall displays
Standard waterfall diagrams, such as the changing frequency spectrum over time, can be displayed in various forms, with three dimensional “bars” representing the results in discrete bins of data.
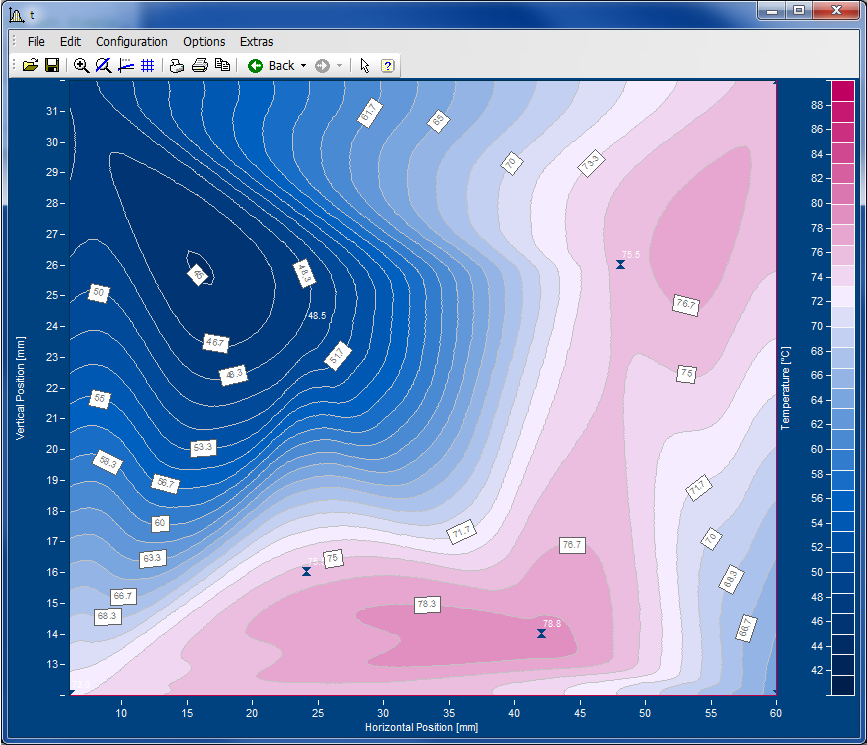
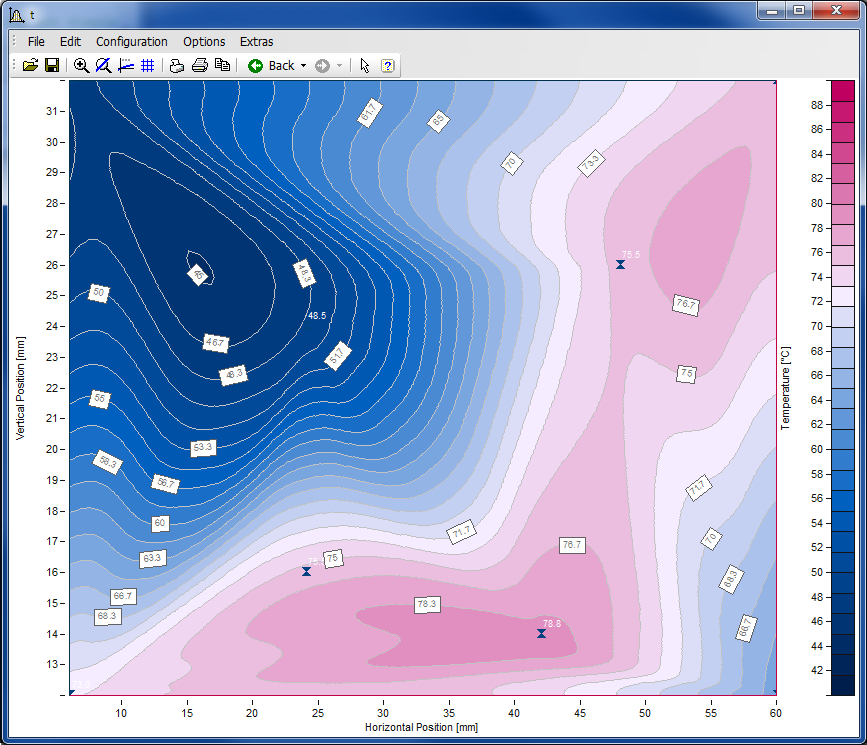
Color maps with line displays
A color map is a common three dimensional representation. Color maps and Campbell diagrams (see right) are commonly used to complex data relationships.

Color maps
The color map is particularly well suited for order analysis, frequency analysis and class counting results.
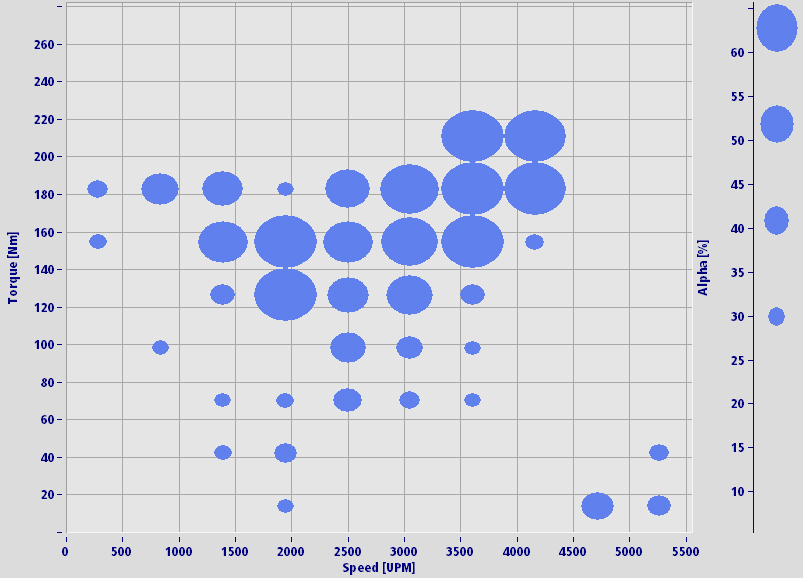
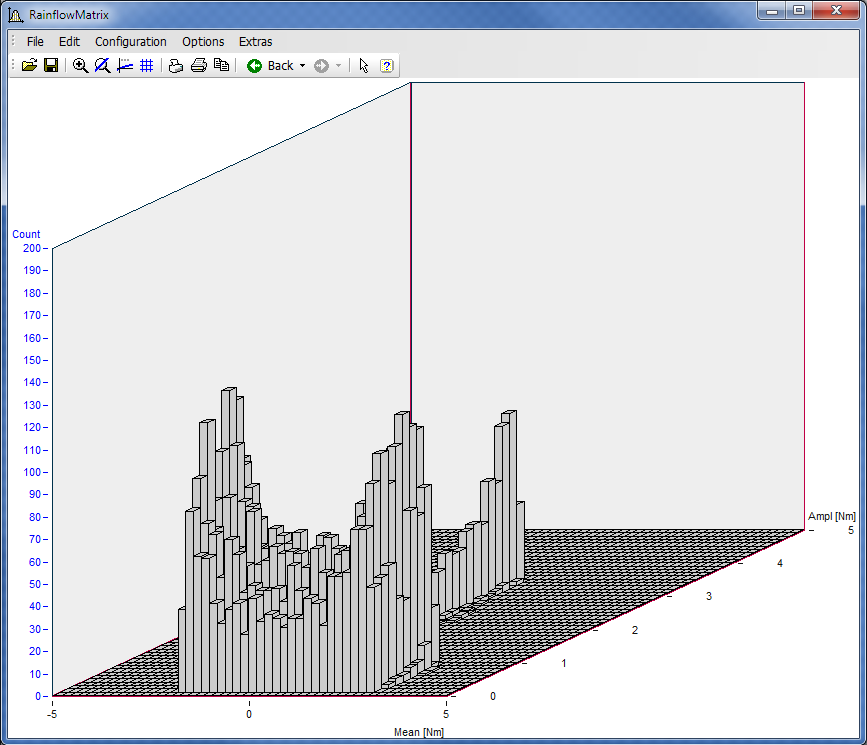
Campbell display
Like the color map, the third dimension of a Campbell display is represented by an alternate scale. In this case, the symbol size or symbol fill. This type of graph is most commonly used in data analysis resulting in a 2D matrix of discrete "binned" values.

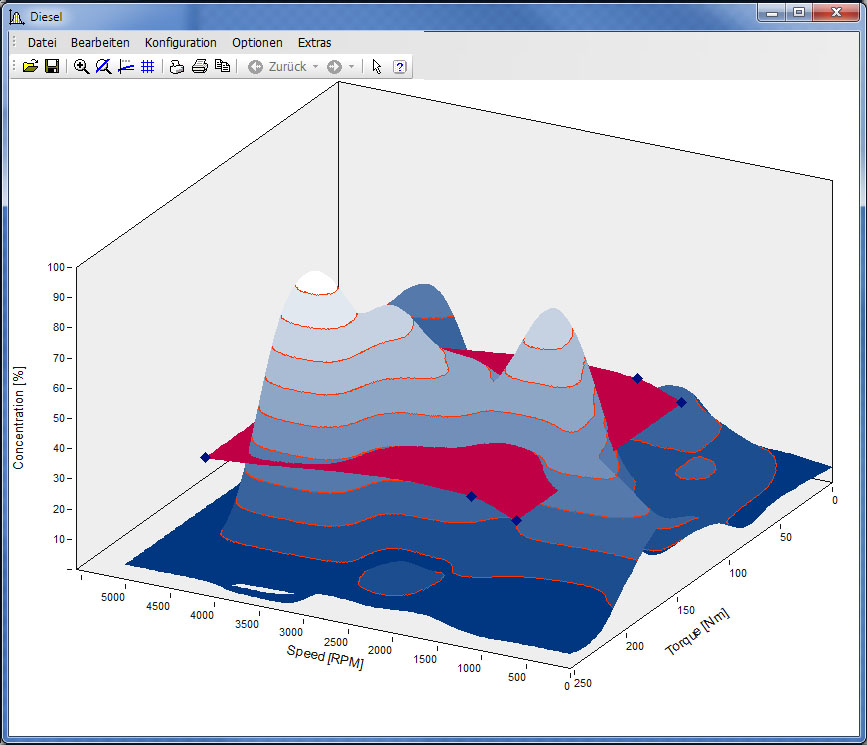
3D surface displays
The 3D surface plot helps to understand complex measurement data and analysis results. The 3D cursor allows measurements along the surface, while the 3D view tool allows rotation along any axis to see "hidden" information. Using the slice tool, dynamic 2D representations along constant x or z-value cursors may also be displayed, offering a more quantitative look at 3D results.
Easily change between display forms
Easily move between the different display types, choosing the most appropriate for the information at hand.
Contact us
imc Test & Measurement GmbH
Voltastraße 5
13355 Berlin (Germany)
Headquarters | info@imc-tm.de
France | hotline@imc-france.com
USA | accounts@imcdataworks.com
China | cnsales@imc-tm.com
Spain | info@imc-tm.es
South Korea | hotline@imc-tm.kr
Switzerland | info@imc-tm.ch
Netherlands | info@imc-benelux.com
© imc Test & Measurement GmbH. All rights reserved. Privacy. Incident Reporting. Company Information.